Justaddwater.dk January 2006 Statistics
January is so far the most visited month. To give you an idea of who you and your fellow readers are, here is our first statistics posts for the new year. As usual we have filtered out our own hits so the numbers below only show “real” readers :)
More readers
As mentioned above, January was the month where we really got noticed around the world. Just see the rising graph below where we top around Thursday/Friday the 26th or the 27th with over 130 visitors:
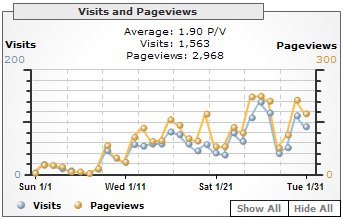
Visits and Pageviews, January 2006 – Source: Google Analytics
Top 5 Stories
One post in particular has drawn a lot of attention. Part of this is of cause because of its provocative claim that a quarter of all web users are disabled. We have gotten a lot of feedback on this and many people feel that the use of the word “disabled” is to much. That besides we should not ignore the fact that the story has many interesting points that we should keep in mind when designing and developing new websites. Anyway… less talk more numbers:
- One of four web users are disabled users (238 visitors)
- AJAX performance stats, ROI, and business value (217 visitors)
- Live search explained (160 visitors)
- Windows Vista setting new standards for Find-as-You-Type searching (109 visitors)
- Google Analytics trick: How to view referring URLs (69 visitors)
Source: Measure Map
Browser Versions
This month Mozilla Firefox have surpassed Internet Explorer and can now claim 1st place with a 48.62% piece of the cake as the most used web browser on our weblog. Also Mac users using Safari and the readers with the Opera browser can claim a higher share than last month.
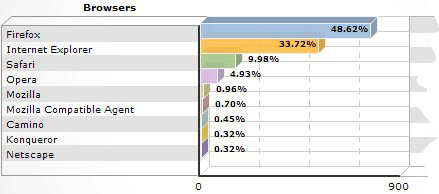
Browser Versions, January 2006 – Source: Google Analytics
Statistical numbers
| Total visits: | 1,563 |
| Total unique visitors: | 1,185 (2.78% returning) |
| Average visits per day: | 50.42 |
| Average pageviews per visit: | 1.79 |
| Dropout percentage on the front page: | 45.88% |
RSS/Atom
Around 15% of our hits come from news feed aggregators. This is a bit lower then previously where it was around 25%. This is mainly due to the high number of referrals we have gotten throughout January. As usually RSS and Atom hits have a certain amount of uncertainty build in since news aggregators checks for updates every x minutes – even if there is none – so that adds to the total as well.
Other graphs
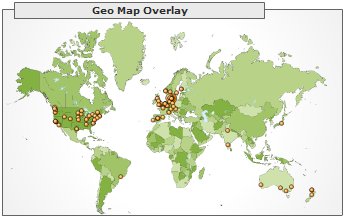
Geographical reader location, January 2006 – Source: Google Analytics
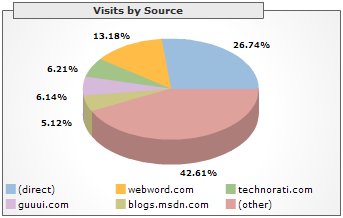
Visits by Source, January 2006 – Source: Google Analytics
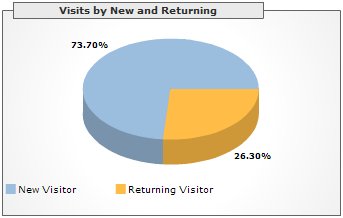
Visits by New and Returning, January 2006 – Source: Google Analytics
Technorati Tags: statistics, web statistics, analytics, google analytics, measure map, blogging, browser versions, browsers
