Data Visualisation
What a treasury of old and new maps, images, graphs — all you can imagine. www.math.yorku.ca/SCS/Gallery/milestone/ (found via wikipedia: information graphics)

Actually, I’m in the middle of preparing a workshop where some of these visualizations can serve as background inspiration material.
Update later same day: Add to this the Periodic Table of Visualization Methods:

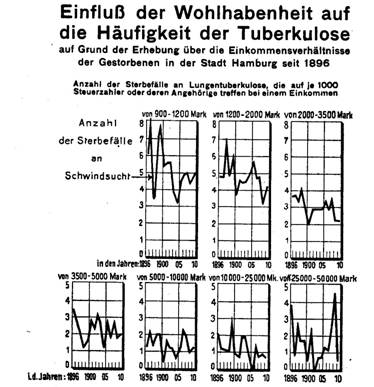
Just including a few here for inspiration:

Technorati Tags: design, inspiration, graphs, visualization

February 12th, 2008 at 20:37 (GMT-1)
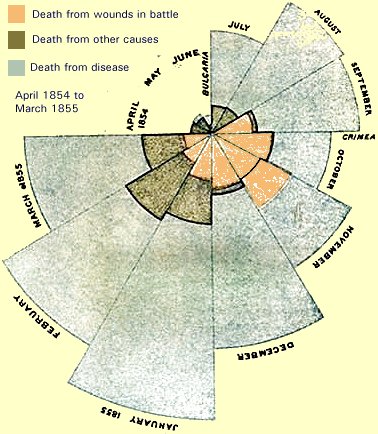
I love the…exploded pie-chart? (What do you call the one beginning with “Death from wounds in battle”?) I’ve always thought it was overly confusing. Is the data represented by distance from the center or by the area in square units? Do the different data sets overlap or not (that is, does the outermost point for a month represent the total number of deaths, or does it represent the number of deaths from the most frequent cause of deaths)? Also, the circle implies cyclical repetition in a way that isn’t quite accurate when used with specific month-year combinations.
All that said, I’ve always loved it anyways, knowing that I could never bring myself to use it.
February 16th, 2008 at 01:54 (GMT-1)
[…] Usability blog Justaddwater reminds us that showing data visually doesn’t have to be boring. In fact, some of the examples here could be matted, framed and hung on your wall. Check out the “exploded pie chart,” […]
June 26th, 2008 at 05:52 (GMT-1)
The Secret movie was an awesome example of how the law of attraction can summon the universal powers to manifest people situations and material things into your life.
All of the presenters had compelling stories that described in detail how their lives changed once they applied the secret principals.
I watched the movie several times only to discover the secret was never revealed nor did they explain how to actually make the law of attraction work in your favor.
I searched for a year and finally discovered exactly how the secret law of attraction works.
Anybody can put the principals to work for them and change their life dramatically in a short period of time.
It’s true, they are laws and they work all the time but its your choice to make them work for you and not against you.
January 19th, 2012 at 22:01 (GMT-1)
A lot of Universities have some nice learning tools, graphs and maps. Quite a few of them list the resources on Wikipedia. Here recently I did some research on watt usage for different types of processors. I found a pretty completely list on Wikipedia that laid it all out.
Here’s the link.
http://en.wikipedia.org/wiki/List_of_CPU_power_dissipation