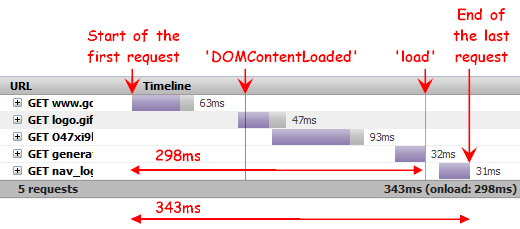
Explanation of Firebug Net Panel Findings
Jan Odvarko – one of the Firebug developers – posted some very good explanations on the information available from the Firebug net panel.

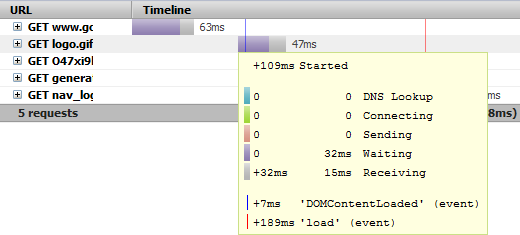
Here is the explanation of the detailed mouseover view when zooming in on each request:

- The second request started 109ms after the start of the first request (since the beginning of the waterfall graph).
- There are two numbers for each request phase (5 phases). The first number on the left says when the phase started within the request. The second number on the right (closer to the phase label) says the time needed to complete each phase. In this case, the first three phases took zero time, and so the Waiting phase was the first real and it needed 32ms to complete. The Receiving phase started in 32nd ms of the request and needed 15ms to complete
- DOMContenLoaded event was fired 7ms after this request started. If this number is negative the event was fired before the request is started.
- load event was fired 189ms after this request started. If this number is negative the event was fired before the request is started.
Here are some notes about each request phase.
- DNS Lookup: DNS resolution time
- Connecting: Elapsed time required to create a TCP connection.
- Blocking (not on the screenshot): Elapsed time spent in a browser queue waiting for a network connection. Displayed only in the case where this situation happens (see also this post).
- Sending: Time needed to send request data to the server.
- Waiting: Waiting for the response (till the first byte is received from the server).
- Receiving: Time necessary to download response body.
I found myself reading up on this because I did a HTML5 offline experiment, where the “HTML5 .manifest files did not appear in Firebug net panel”
Jan Odvarko has two excellent posts explaining most functionality of the Firebug Net panel. The two posts are highly recommendable
- Firebug Net Panel Timings (March 2010)
- Introduction to Firebug: Net Panel (May 2009)

April 26th, 2010 at 12:43 (GMT-1)
The new version firebug is really sucks. It makes slow down the entire web browser. Even there was less functions compare to newer version; it never struck the web browser. Older one is enough to monitor and display the HTML, JavaScript, Php and other elements of webpage
April 26th, 2010 at 13:35 (GMT-1)
@Mack – what are you running alongside Firebug? Yes, it does slow down the browser a bit but the number of other plugins/software that you’re running puts an even bigger load on your machine. Try disabling any plugins you don’t need during execution. I did this and now my browser is workable – not the fatest load times but definitely better.
April 30th, 2010 at 14:47 (GMT-1)
Very thorough! A bit of an unrelated question, how much HTML 5 experimentation have you been involved with so far, Mack? I’m sure you saw where Steve Jobs wrote his response to none of Apple’s devices supporting Flash, etc., and went on about HTML 5. I haven’t messed with it at all yet, personally. Do you have any good recommendations for getting started with it? Thanks!
-Fried
April 30th, 2010 at 14:50 (GMT-1)
*Jesper (not Mack — I was reading his name when I wrote that comment. lol) Thanks.
-Fried